People

In this series of posts, we are focusing on the increasingly important topic of Big Data and its role in merger control assessments. In Part 1 we set out what we mean when we refer to Big Data and what the competition authorities are looking to understand from Big Data. Part 2 then defined structured versus unstructured data and considered the importance of layering facts and context when interpreting the information in front of you. In Part 3 we touched on lessons from the coal face and the challenges of responding to expansive data requests from competition authorities, including when to engage with Big Data.
In this final post of the series, we explore the techniques advisors can use to turn the mountain of data and documents into targeted proactive analysis that advances the case for merger clearance. Often the type of analysis will depend on the ‘what’ – i.e. what are the likely theories of harm or competition issues at the heart of the merger. The below hopefully gives you a flavour of what is possible and what has been successful in recent cases we have worked on.
Geo-spatial analysis
Local area mergers involving retailers, wholesalers or service providers (think gyms, or supermarkets) often focus on the geo-spatial element – i.e. where the Parties are located relative to each other, to other competitors, and their customers. However, defining a catchment area within which the Parties compete and identifying and weighting the ‘competitive set’ (i.e. the rivals that constrain the Parties) poses challenges. An in-depth analysis of these issues can be found here. In this post we will highlight a few ways in which geo-spatial analysis can be harnessed to show limited competition issues from a merger:
- First, the store/outlet location data may show an overlap between the Parties stores, say within a defined drive time catchment area of 20 minutes. At this point a store count analysis may show a problematic local area reduction in competitors (i.e. a ‘5 to 4’ or a ‘4 to 3’). If so, customer location data (e.g. from loyalty cards or survey data) becomes increasingly important to highlight whether customers consider the two Parties as credible alternatives. A deeper analysis might reveal that, despite being within each other’s hypothetical ‘catchment area’, the Parties draw their customers from different areas and the actual ‘overlap’ at the customer level is limited or non-existent.
- Second, even if there is a strong overlap at the customer level (i.e. customers are drawn from a similar area), this may not tell the whole story about local competition. In previous cases we have successfully deployed ‘heat maps’, which combine customer location and revenue data, to understand where the concentration of revenue from a store is derived. Two stores drawing customers from a similar geographical area, may have very different revenue concentrations within those overlaps, limiting the actual competitive interaction.
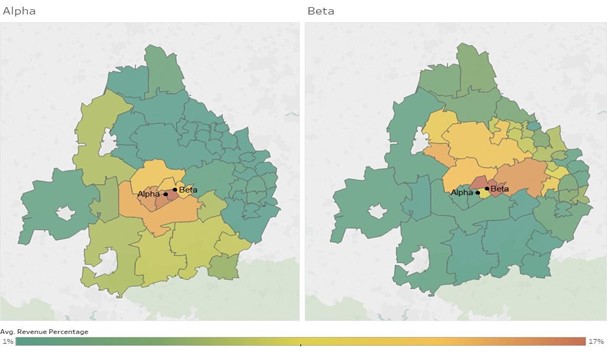
Figure 1: Use of geospatial analysis demonstrating that although the stores Alpha and Beta are close to each other and have overlapping customer catchment areas, the overlap in terms of revenue is small.
Inexact (fuzzy) matching
As we explored in previous posts, data comes in many shapes and sizes, with some unstructured data (i.e. human-generated) presenting additional challenges. A technique we have employed in a few cases is that of inexact matching (AKA fuzzy matching). In its simplest form, this technique compares two text strings to try and determine whether they represent the same object (e.g. product, person, location etc.). The power of a fuzzy match is the ability to identify matches between two pieces of text that are close but not exact. For example, you might need to identify a competitor “McDonald’s” in a list of survey responses that were typed into a free text box. In addition to the correct answer, respondents may have typed in “MacDonald’s”, or “McDonalds”, which aren’t exact matches, but are almost the same as the correct spelling. Fuzzy matching provides a similarity score for each “match” and allows you to set a similarity threshold to remove any false positives (e.g. setting it to c.70% could remove matches to “Donalds”, if that was another separate retailer).
An example of where this was particularly useful was when one of the merging parties had a price guarantee that matched the cheaper price of another online or in-store retailer. When the match was successful, the till operator was typing in the name of the retailer/website manually into a spreadsheet. This generated a list of 10,000+ unique retailers/website entries (out of 100,000+ entries), when we knew there were only approximately 400 unique retailers. The ability to quickly identify the online retailers via a fuzzy match was critical in this case to demonstrate that online retailers were a competitive constraint at the local level. Other scenarios where you could apply this technique include: matching product names between two different retailers to understand the precise product overlap (where naming conventions are slightly different); or matching customer names to identify a common set of customers served by both Parties.
Web-scraping
As previously noted, identifying the competitor set can be a key step in any competitive assessment. While authorities will rely heavily on internal documents to understand competitors to the merging Parties (particularly at Phase 1), a way to add additional quantitative data into this equation is through web-scraping. This, in effect, creates new structured datasets from semi-structured data that can be interrogated to look for new insights. Web-scraping involves creating a script to systematically harvest information from a web page, including product details and most importantly the price. We have employed this technique in two ways on previous cases:
- First, the Parties will often have good visibility over which products they sell and at what price, but detailed data on competitors may be limited. Web scraping competitor websites or price comparison websites can therefore help understand whether competitors are selling similar products at similar prices. Scraping can also be completed systematically over time to understand competitor price movements and promotions, which can be a useful way to show a rival firm is competing closely with one or both merging parties.
- Second, for online businesses that rely heavily on Google search results, web-scraping (with automated web page handling) can be an effective tool to understand the outcome of Google ad auctions and organic rankings. These relative positions on the search page help show which competitors are bidding for the same key search terms, and therefore the potential competitive interaction and strength of different retailers.
Configurable quantitative models
A lot of the analytics we’ve discussed so far in this series of posts are used to determine facts about the case (e.g. magnitude of sales, number of customers, degree of overlaps, strength of particular competitors etc.). However, for certain cases we need to create a model that provides a quantitative answer to a question, but also allows us to assess the sensitivity of the result to assumptions (i.e. variables) within the model. These configurable models can be very powerful as they allow multiple different scenarios to be explored quickly and efficiently, so we can arrive at an answer that is defensible and where the key drivers for the result can be determined and stress tested against challenge. A good example of this was a case involving the merger between two online retailers selling made-to-measure window blinds. Part of our argument was that the sellers of standard-dimension ready-made blinds did compete with the made-to-measure retailers as customers could and would except certain tolerances in the dimensions of the product. We created a configurable model that determined the proportion of the sales of actual made-to-measure where there was a ready-made equivalent (incidentally the ready-made product set was scraped from the web). By varying the tolerances that the model used to assess equivalent products we were able to explore the sensitivity of the result to these tolerances and arrive at a defensible result that showed c.50% of made-to-measure sales had a ready-made equivalent (compared to the CMA’s analysis of a c.1% overlap).
Concept search and machine learning
When dealing with the challenge of internal communications documents, investigative analytics tools such as Brainspace (other products are of course available) can offer powerful insights to help filter out the noise and build a corpus of evidence that may be supportive or prejudicial to a party’s case. The ability of software to analyse and digest millions of documents quickly and present information back to the user as interactive visualisations, enables subject matter experts (SMEs) to easily see patterns and connections between people, topics and events, through something called concept searching. SMEs can use this analytical concept searching in two main ways:
- Top-down – An SME can dive in from a high level to discover what the key themes (i.e. topics discussed) are present in the documents. This approach provides an immediate overview of the content of the documents and is especially useful at the outset of a case. This can also be very useful when dealing with foreign language documents, as it greatly reduces the need for translation in the early stages and allows any subsequent translation to be prioritized and targeted.
- Bottom-up – In this approach, the SME can start out with one or several seed documents (e.g. a potentially harmful document) to discover how far-reaching a document might have been, which in turn helps experts to contextualise and assess that document’s weight. This gives a very rich insight into specific themes and uncovers key issues in a case, e.g. internal correspondence concerning the parties’ plans post-merger.
Both top-down and bottom-up approaches can help legal teams prepare for anticipated objections to the merger from the authorities, and, in practice, a flexible and iterative approach works best. Concept searching techniques such as this can also be integrated with machine learning algorithms, which can uncover further insight. Documents highlighted through concept searching can be sent to legal teams for review and tagging, and then the results of this can be used as inputs to train an algorithm to identify other related documents, which in turn feeds into the concept searching approach. This can be used iteratively to drill down into topics, determine whether they are of interest, and refine searches based on human review. These analytical tools are very powerful, but are only as good as the person using them, so having SMEs who know how to get the best out of the tools will be key to the difference that they can make.
Conclusion
A lot of the Big Data challenges in Merger Control cases can feel very reactive where the client and their advisors are on the back-foot responding to lots of requests from the competition authority. Whilst responding to these requests in a timely, complete, and accurate fashion is key to maintaining good relations with the competition authority, the reactive nature can feel frustrating at times. In this post we’ve explored a few of the ways one can harness Big Data to shift the team onto the front foot, producing analysis and arguments that advance the case for merger clearance. This includes challenging assertions or assumptions made by the competition authority or allowing potential compromise scenarios to be explored (e.g. partial divestitures, remedies/commitments etc.).
We hope that you have found this four-part series useful and insightful. As a reminder here are a few of the key themes we have explored in this series:
- Big Data is often described using the Five Vs, but we add a sixth (Vintage) to capture the challenge of dealing with old data from legacy systems, a frequent challenge on merger control cases.
- Not all data is created equally. There is a clear spectrum of data: from human-generated unstructured data at one end, to highly structured (but often complex) data stored in enterprise databases at the other. Unstructured and structured data present very different analytical challenges, and specialist teams are therefore often required to deal with both of these.
- Big Data can be both friend, and foe. Internal documents can paint a skewed view of how the company views the market and its competitive position, so contextualizing these is very important. Structured data allows you to surface the facts of the case and can be used as a useful counter to inaccurate assertions made in internal documents.
- Competition authorities are demanding ever more voluminous quantities of data, but the timescale for providing this data remains stubbornly short. Getting to grips with the data as early as possible helps you keep on top of requests whilst leaving capacity within the team for proactive analysis.
- Pro-active data analytics allows you to tap into the power of the data to generate insights into the case that might otherwise not be available to you (or be based solely on conjecture). Putting hard numbers behind your arguments increases the chance that these will be heard. Equally, making sure your other arguments are also supported by the facts avoid the embarrassment of having these taken apart by the competition authorities.
That’s all from us in this series on Big Data in Merger Control. Please do get in contact with us to share your own views and experiences on this topic, or any other merger-related topics.
The 'Big Data in Merger Control' series: