Skip to contentSkip to footer
People

Elevated working capital requirements and rising interest rates demand a call for action
This report discusses the financing requirements arising from elevated working capital requirements, in particular driven by increased inventory levels, the growing tension between payment terms of trade receivables and trade payables, and the strains caused by higher interest rates and a backlog of investment. Key findings and highlights based on a review of the Global Aerospace and Defense industry in brief*:
- Working capital requirements continue to rise - an increase of 31% (€74 billion) - from €235 billion in 2018 to €308 billion in 2022
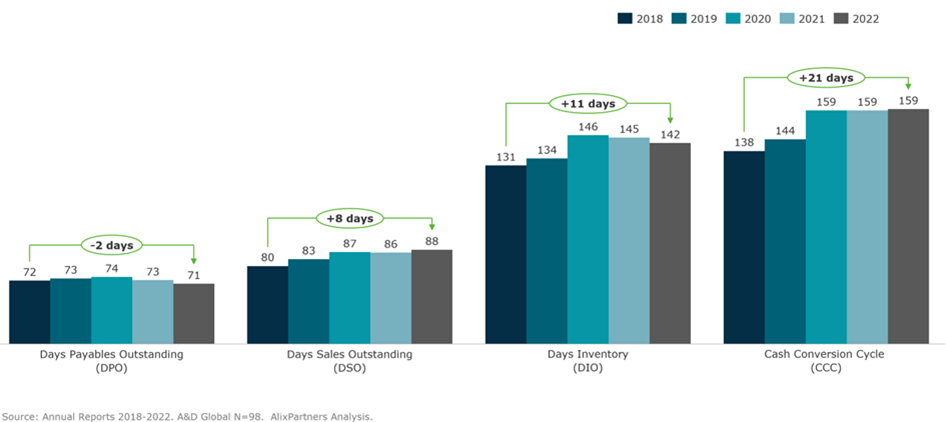
- Cash conversion cycle is expanding by 21 days to reach 159 days in 2022 versus 138 days in 2018
- Inventory levels remain elevated with 142 days coverage, an increase of 11 days compared to pre-COVID levels of 2018, and the central driver for the increase in working capital requirements
- EBIT Margins have recovered and stand at 7.8% in 2022, still 0.6pp (7%) below the 8.4% mark in 2018. Profitability has recovered since the COVID shock, when it dropped to 4.6% but remains muted and under pressure again
- Debt-to-equity ratios have reduced to reach 0.85x in 2022 after peaking in 2020 with 1.04x, mainly due to sharply reduced investment cash flows (-49%) and capex (-31%) over the last five years, in fact dropping below the 0.86 level reached in 2018, but with a significant backlog of investments.
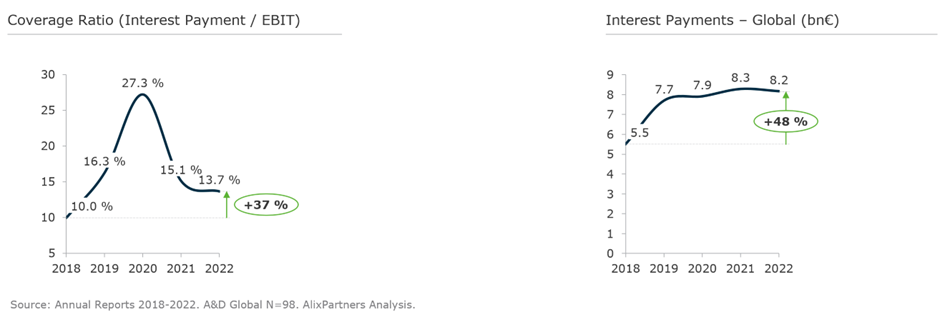
- Higher interest payments restrict financial conditions further, reflected in the increase in interest coverage ratio (interest/EBIT) from 10% in 2018 to 14% in 2022.
- Working capital programs focusing on inventory optimization are a key lever to counteract the growing financing requirements and risks associated with elevated working capital requirements, concerns about future profitability, rising interest rates, and a backlog of investment
Working capital requirements continue to rise: +31% since 2018
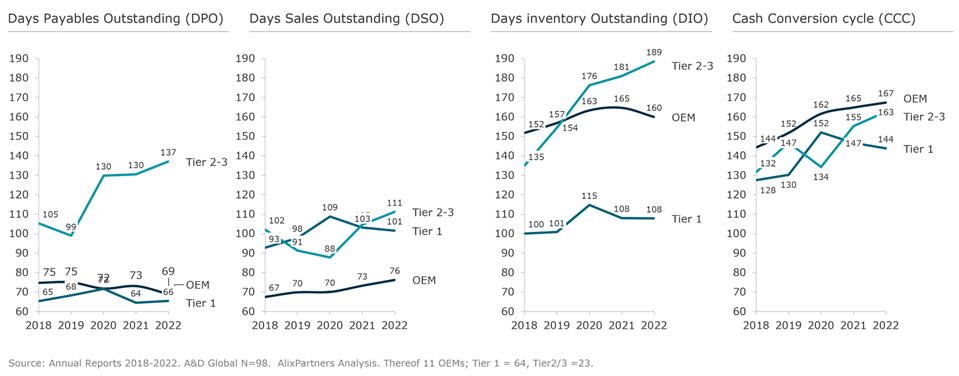
Our analysis of the working capital requirements in the aerospace and defense sector reveals a significant increase of 31% from €235 billion in 2018 to €309 billion in 2022. The cash conversion cycle has also lengthened, going from 138 days to 159 days, necessitating companies to finance the elevated working capital for an additional 21 days. This impact is particularly pronounced in original equipment manufacturers (OEMs) and Tier 2-3 suppliers, with OEMs facing an increase of 23 days and Tier 2-3s grappling with an increase of 31 days. In contrast, Tier-1 suppliers have managed with a relatively smaller increase of 12 days, resulting in a cash conversion cycle of 144 days for Tier-1, while OEMs and Tier 2-3s now face approximately 165 days.
Inventory growth and factors influencing it: +29% since 2018
The inventory levels in the aerospace and defense industry have experienced a notable surge, growing from €192 billion in 2018 to €248 billion in 2022. Days inventory have increased by 11 days, from 131 days to 142 days. This trend is primarily observed in Tier 2-3 suppliers, whereas OEMs and Tier-1 suppliers have experienced a more modest increase of 8 days. As a result, Tier 2-3 suppliers now operate with 189 days of inventory, while OEMs have around 40 days less and Tier-1 suppliers have 80 days less.
Several factors contribute to the inventory growth in the industry. Firstly, reduced demand and the grounding of the B737Max have built up inventory levels. Additionally, long lead times, which can stretch up to two years, have necessitated companies to maintain higher levels of safety stock. Last but not least, decreasing confidence in supply chain capabilities to deliver parts on time has driven program managers to increase buffers. Furthermore, inflationary pressures have played a role in driving up inventory levels.
The COVID-19 pandemic caused a shock and desynchronization of the aerospace and defense supply chain. This disruption has had a negative impact on inventory levels that persists today. Notably, fast-changing circumstances and uncertainties in OEM take-rates, such as a significant decrease in Primes Single Aisle production rate and ongoing ramp-ups, have contributed to the inventory challenges. Operational and quality issues on aircraft production have further exacerbated the situation.
Furthermore, the temporary disruption of inbound supply, driven by uncertainties surrounding the delivery of raw materials and components, particularly those with long lead times, such as titanium, has forced companies to increase buffer stock. These challenges have compelled aerospace and defense firms to make difficult business decisions, striking a delicate balance between cash requirements and delivery performance. However, it is worth noting that the supply chain disruptions are now easing, and Tier 2-3 suppliers are facing mounting pressure due to the pre-financing of inventories for the ramp-up.
Trade Receivables and Payables: +22% since 2018
Trade receivables have also witnessed an increase from €157 billion in 2018 to €192 billion in 2022. Customers now take longer to pay their bills, with days payables outstanding rising by more than a week to 88 days. This effect is observed across OEMs, Tier-1s, and Tier-2-3s. However, OEMs manage to collect their trade receivables within a shorter timeframe of 76 days, while Tier-1 suppliers require more than 100 days.
On the other hand, trade payables have increased from €115 billion in 2018 to €132 billion in 2022. Despite the initial minimal stretching of trade payables by 3-4 days during the COVID-19 period, companies have now reversed back, with payments being made after approximately 10 weeks (71 days in 2022, compared to 72 days in 2018). Notably, Tier 2-3 suppliers operate with a significantly longer payment period of 130+ days, having stretched their payments by more than 30 days. In contrast, Tier-1 suppliers operate at 65 days and have accelerated their payments by 9 days. OEMs have experienced relatively unchanged payment terms, remaining at 65-69 days.
In practice, aerospace and defense companies often fail to fully leverage their contractual terms, primarily due to challenges in ramp-up activities and complex engineering changes that result in complications and delays in invoicing and collection. Hence, it is imperative for companies to review their internal processes to ensure timely and accurate invoicing, enabling prompt payment.
Development of working capital requirements 2018-2022 (bn€)

Development of cash conversion cycle 2018-2022 (days)
Development of cash conversion cycle by Tier-level 2018-2022 (days)
Profitability recovered after the COVID shock
In 2022, the aerospace and defense industry achieved an EBIT margin of 7.8%, which remains 0.6 percentage points (7%) below the margin recorded in 2018. Although there has been some recovery in profitability since the COVID shock, the overall performance remains muted. Moreover, the industry is currently facing renewed pressure on profitability due to various factors (inflation, labor cost and shortage, supply chain disruptions), with the ability to pass on inflation-induced price hikes being a prominent concern. While some companies have established dedicated teams to address inflation risks since early 2021 and are successfully passing on price increases, others continue to grapple with avoiding carrying losses from 2021/2022 into 2023. This highlights the varying levels of preparedness and effectiveness in managing inflation.
Figure 4: Development of EBIT margin 2018-2022 (%)

The debt-to-equity ratio has decreased with significantly lower investment cash flows and CAPEX
The leverage measured by the debt-to-equity ratio stands at 0.85x in 2022 and is again below the 2018 levels. In the peak of the COVID crisis, the leverage had reached 1.07x and has been fully reverted over the last two years, driven by strong reduction in investment cash flows (-49%) and lower CAPEX (-31%). However, this reduction in leverage ratio has resulted from a significant backlog of investments that is likely unsustainable going forward.
Figure 5: Debt-to-equity ratio, Investments Cash Flow, and CAPEX development 2018-2022

Improvements in working capital can contribute significantly to financing much-needed investments without increasing the leverage ratio again. Optimizing the cash conversion cycle by one day releases approximately €1.9 billion in liquidity. Closing the gap of 21 days compared to 2018 (159 days versus 138 days) amounts to €40 billion for the 98 aerospace and defense companies analyzed alone. While these figures hold true for the industry itself, companies need to assess their individual situation very carefully to draw the right conclusions and implement the right measures.
Financial conditions restricted via increased interest payments
The interest coverage ratio of aerospace and defense companies has risen from approximately 10% in 2018 to approximately 14% in 2022 due to higher interest expenses and profitability under pressure, further constraining financial flexibility going forward. At the height of the COVID crisis, companies spend more than every fourth Euro on interest payments alone. With the recovery in profitability, this has reversed again. However, with interest rates continuing to rise sharply beyond 2022, companies are likely on the path to spend every fifth Euro on interest payments again. The 98 companies analyzed spent in total around €8.2 billion on interest payments in 2022, an increase of 48% versus 2018.
Figure 6: Interest payments and interest coverage ratio (Interest Payment/EBIT) 2018-2022
The increase in benchmark interest rates and the restrictive stance of rating agencies and banks toward the aerospace and defense sector are driving up interest expenses. Further deterioration in conditions is expected with an increased focus on ESG criteria. The increase of 1 percentage point in interest rates would raise the interest coverage ratio to 19%, forcing companies to allocate an additional €3 billion and nearly a fifth of every Euro earned to servicing interest expenses.
Conclusion: A&D companies need to establish working capital programs with a focus on inventory optimization as a key lever
Elevated working capital levels, the expected industry ramp-up, the backlog of investment as well as the increasing financing costs due to rising interest rate payments demand a call for action. To address these challenges, aerospace and defense companies should consider a comprehensive working capital program focused on optimizing inventory levels, trade receivables, and trade payables supported by investment planning that balances the need for capital expenditure with financial constraints, prioritizes critical investments required for production ramp-up, and overall operational efficiency.
Improvements in days inventory require strategies to manage and reduce inventory levels without compromising production ramp-up plans. Our project experience shows a comprehensive program is required, which goes beyond simple inventory rationalization and includes the following:
- Review and optimization of inventory policy: Conduct a thorough review of inventory parameters and policies to identify opportunities for optimization. This includes reassessing safety stock levels, reorder points, and order quantities, as well as policy adherence.
- Enhancement of production planning: Improve the planning of production starts and stops by aligning them with demand forecasts and adjusting order and production batch sizes accordingly.
- Improvement of inventory transparency: Implement robust measurement and reporting mechanisms. This includes tracking KPIs, such as turnover rates, projections, and aging analysis, and establishing early warning indicators to identify potential inventory issues proactively.
- Improvement of planning and forecasting accuracy: Invest in advanced planning and forecasting capabilities to enhance accuracy. This can involve leveraging data analytics, customer insights, and historical demand patterns to generate more reliable forecasts and to align production and inventory levels accordingly.
- Increased flexibility: Enhance flexibility in inventory management by adjusting fixation horizons and lead times. This enables quicker responses to changes in demand and reduces the risk of carrying excess or obsolete inventory.
- Supplier collaboration and relationship management: Strengthen collaboration and foster closer relationships with key suppliers to improve inventory availability, reduce stockouts, and optimize working capital. This can include establishing joint forecasting and planning processes, sharing demand and production information, and exploring opportunities for consignment inventory or vendor-managed inventory arrangements.
- Optimization of transport routes: Evaluate and optimize transport routes, pickup, and delivery points to reduce lead times and improve overall efficiency in inventory management. This can involve collaborating with logistics partners and leveraging technology solutions to streamline transportation processes.
- Management of maintenance and repair: Implement a spare parts management strategy that considers failure probabilities and capital tie-up costs. This ensures optimal inventory levels for maintenance needs while minimizing unnecessary inventory holding costs.
- Clean-up of excess and obsolete inventory: Conduct regular reviews and take proactive measures to identify and address excess and obsolete inventory. This includes implementing clearance strategies to minimize write-offs and capital tie-up costs.
- Excellence in inventory processes: Focus on operational excellence in inventory management by improving the timeliness of receipt and posting of supply and production inventory. Streamline processes, reduce bottlenecks, and enhance coordination among relevant teams to ensure smooth inventory operations.
Improvements for days receivables and days payables range from reviewing and adjusting policies including conditions for trade-offs in EBIT for cash, next to streamlining internal processes to ensure timely and correct invoicing. Accounts receivables and payables measures include the following:
- Standardization and optimization of payment terms: Implement and enforce standardized payment terms based on supplier and customer segmentation, ensuring favorable terms for different categories (e.g., default standard terms for C-customers that are non-negotiable). This standardization not only directly improves working capital by accelerating cash inflows but also reduces complexity and process errors, indirectly improving working capital management.
- Streamlining invoice and cash collection processes: Review and redesign payment processes considering standard payment runs, and grace periods to improve AP. Review and redesign invoice and cash collection process, e.g. enforcing day-to-day collection discipline, minimal grace periods, installation of electronic payments, and consider outsourcing of problem collections. Eliminate root causes for late payments, such as invoice errors, to enhance overall cash flow efficiency.
- Improvement of working capital transparency through measurement and reporting: Establish a standardized working capital reporting framework and governance structure. This includes implementing regular reporting mechanisms, such as a weekly overdue reporting system, to be reviewed in dedicated meetings involving sales, accounting, and other relevant stakeholders. By improving transparency, firms can proactively identify and address working capital challenges.
- Establish a link between commercial and financial responsibilities: Foster alignment by linking responsibilities from the commercial (Sales for AR, Procurement for AP) and financial side (Accounting, Controlling). This collaboration ensures a holistic approach to working capital management and facilitates effective coordination between departments to optimize cash flows.
- Alignment of management targets and incentive schemes with cash performance: Revise management targets and incentive schemes to include cash-related key performance indicators (KPIs) alongside traditional metrics like EBIT/EBITDA. This ensures that cash generation and working capital efficiency are given due importance, motivating and rewarding managers for driving cash flow improvements.
Setting up and running a comprehensive working capital program on top of the already intense daily business is often difficult to implement in existing company structures. Therefore, a dedicated core team should take over the coordination of the working capital program for four to six months to lift working capital efficiency to a new and significantly improved level, freeing up cash for much-needed investments going forward. To make the impact sustainable, the development and adjustment of working capital guidelines should be an integral part of the effort.
Please contact our authors if you have any further questions and would like to discuss setting up effective working capital programs and optimizing inventory.
* Review covers 98 publicly listed aerospace and defense companies around the globe. Thereof 11 OEMs; Tier 1 = 64, Tier2/3 =23.